When it comes to the region’s response to potentially dangerous coastal storms, Hampton Roads is providing crucial data.
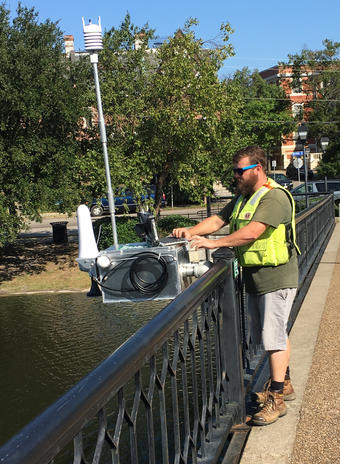
A rapid-deployment tide gauge is added during Tropical Storm Jose. Photo: Howard Ross, USGSThe U.S. Geological Survey (USGS) has a network of 23 tide gauges installed throughout Hampton Roads and the Eastern Shore of Virginia. During a storm event like Jose or Maria, even where there is no direct impact on the Mid-Atlantic, water can be pushed from the mouth of the Bay into the Hampton Roads harbor, causing minor flooding.
Permanent tide gauges measure continuous water levels every six minutes in areas where there is frequent nuisance flooding. And when a storm event is on the way, USGS can deploy extra “rapid deployment” gauges in targeted areas. These gauges can measure wind speed, direction, rainfall, barometric pressure, humidity, and air temperature, all in addition to water level.
USGS has demployed a handful of them ahead of Maria.
USGS Hydrologist Russ Lotspeich tells Bay Bulletin that one of those temporary gauges can be dropped in the water and programmed within just 15 minutes, providing water level measurements almost immediately. The information is available in near-real time on the USGS website. To check the tide gauges for a certain area, click here.
That information can be invaluable to homeowners, business owners, or even someone who is trying to decide whether they need to move their car away from a low-lying area, says Lotspeich. Local and regional governments also factor it in.
“City officials can use this data to make emergency decisions during a storm, such as when to close roads and issue evacuation orders,” said Lotspeich.
The National Weather Service (NWS) uses the water level and meteorological data collected by the gauges to help with their storm surge and flood warnings.
And after a storm event is over, USGS and NWS can compare a predicted storm surge or flood with what actually happened, in order to determine how accurate the forecast turned out to be.
This tide gauge network has been actively collecting tide elevation data since the first gauge was installed on the Severn River in January 2015. The project is funded by numerous city, county, municipal and federal cooperators in the area.